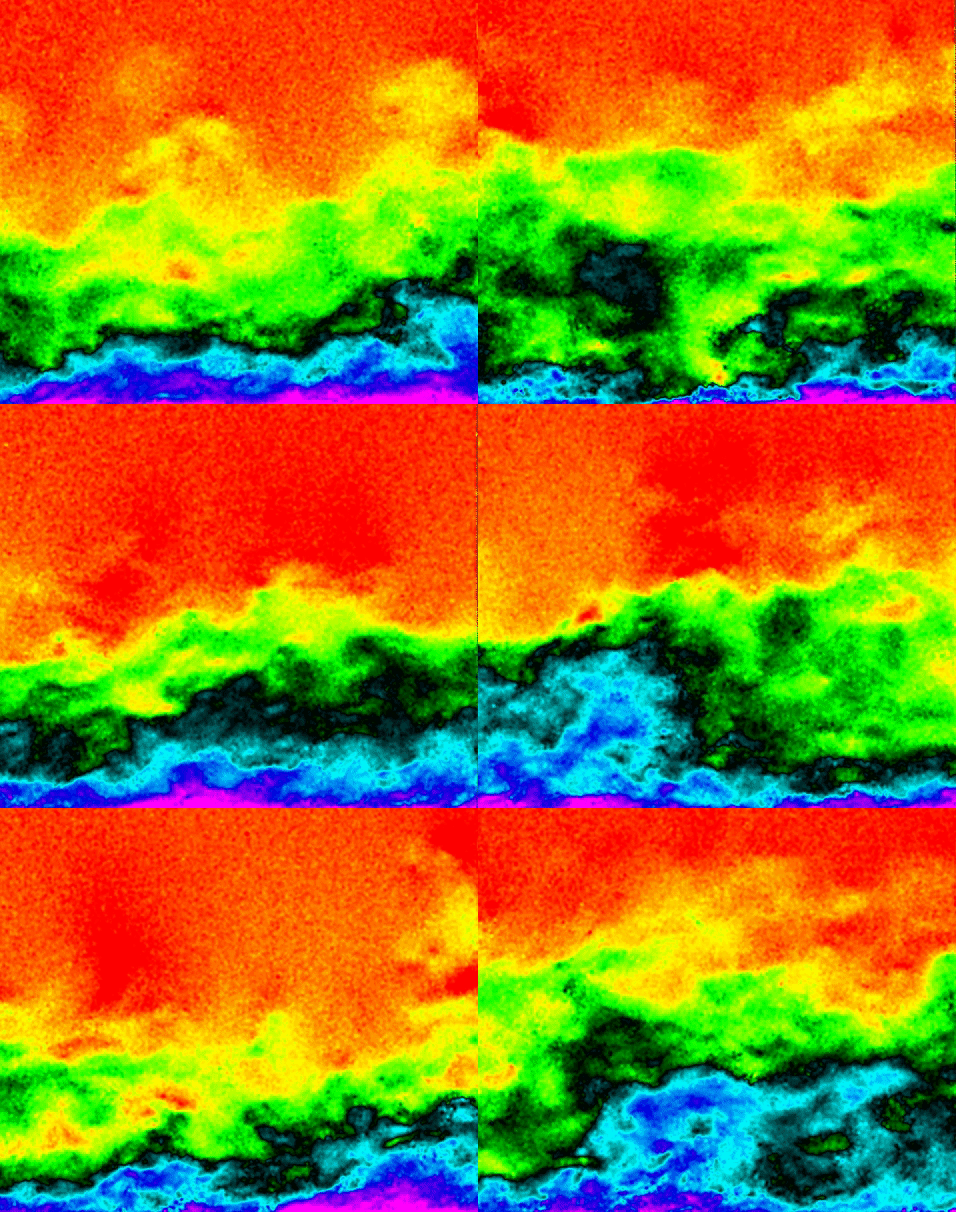
A time series of particle image velocimetry data showing the behavior of a turbulent boundary layer on a zero-pressure gradient flat plate.
This gif is a series of images showing a turbulent boundary layer that has developed on a flat plate in a wind tunnel. The images were captured using a particle image velocimetry technique that involves a flow seeded with smoke particles, a laser sheet parallel to the flow, and a high speed camera that captures a double frame to calculate velocity vectors of the flow. The colors indicate velocity magnitude ranging from 25 m/s in red down to approximately 13 m/s in magenta.

9 Comments. Leave new
I like the unique flow physics captured and the application to this class. It is very different from many of the submissions I’ve seen this far. It is interesting to have the visual of the boundary layer velocity using different colors.
The way you can see the velocity profile in the turbulent boundary is very interesting.
Stunning method of showing the turbulence of the flow along a flat plate. How did you determine which of the three experimental zones to show?
This is an incredible visualization of turbulence. I love that it is a .gif too, it makes it easy to understand the progression.
The gif is really cool to see how it changes with respect to time.
Great idea making it a gif. Well-done!
The GIF format allows us to see the change over time. Well done!
This animation is stunning. Very well done.
This is neat to see and I like how it describes the air so well